A lipid panel can feel like a short note written in a language you never studied. Four numbers, a few flags, and suddenly you’re trying to predict your future.
Here’s the good news: most lipid panel results can be understood in minutes, if you read them in the right order. This guide gives you a one-page way to scan your report, spot the “why,” and choose the next step that makes sense for your body and your goals.
This is general education, not personal medical advice. Your targets can be different based on age, diabetes, blood pressure, meds, and family history.
What a lipid panel measures (and what it’s really telling you)
Your lipid panel is a snapshot of fats and fat-carrying particles in your blood. Think of your bloodstream like a river. Cholesterol and triglycerides are “cargo,” and lipoproteins are the boats. Too many risky boats, or the wrong cargo mix, can raise long-term heart risk.
Most standard panels include:
- Total cholesterol: a broad total of cholesterol in circulation.
- LDL-C (often called “bad” cholesterol): tends to be the main treatment target.
- HDL-C (“good” cholesterol): helps carry cholesterol away from artery walls.
- Triglycerides: a blood fat strongly shaped by sugar, refined carbs, alcohol, and insulin resistance.
Some reports also show non-HDL cholesterol (total cholesterol minus HDL). Non-HDL is useful because it captures more of the “artery-sticking” particles than LDL alone.
Fasting rules vary. Triglycerides change the most after meals, so your clinician may ask for fasting if triglycerides are a key concern. If you want a plain-English refresher on what each number means, Cleveland Clinic’s guide is clear and current: cholesterol numbers explained.
Your one-page lipid panel guide (quick ranges + plain meaning)
Use this as a fast “scan and sort” page. It won’t replace your clinician, but it will stop the numbers from feeling random.
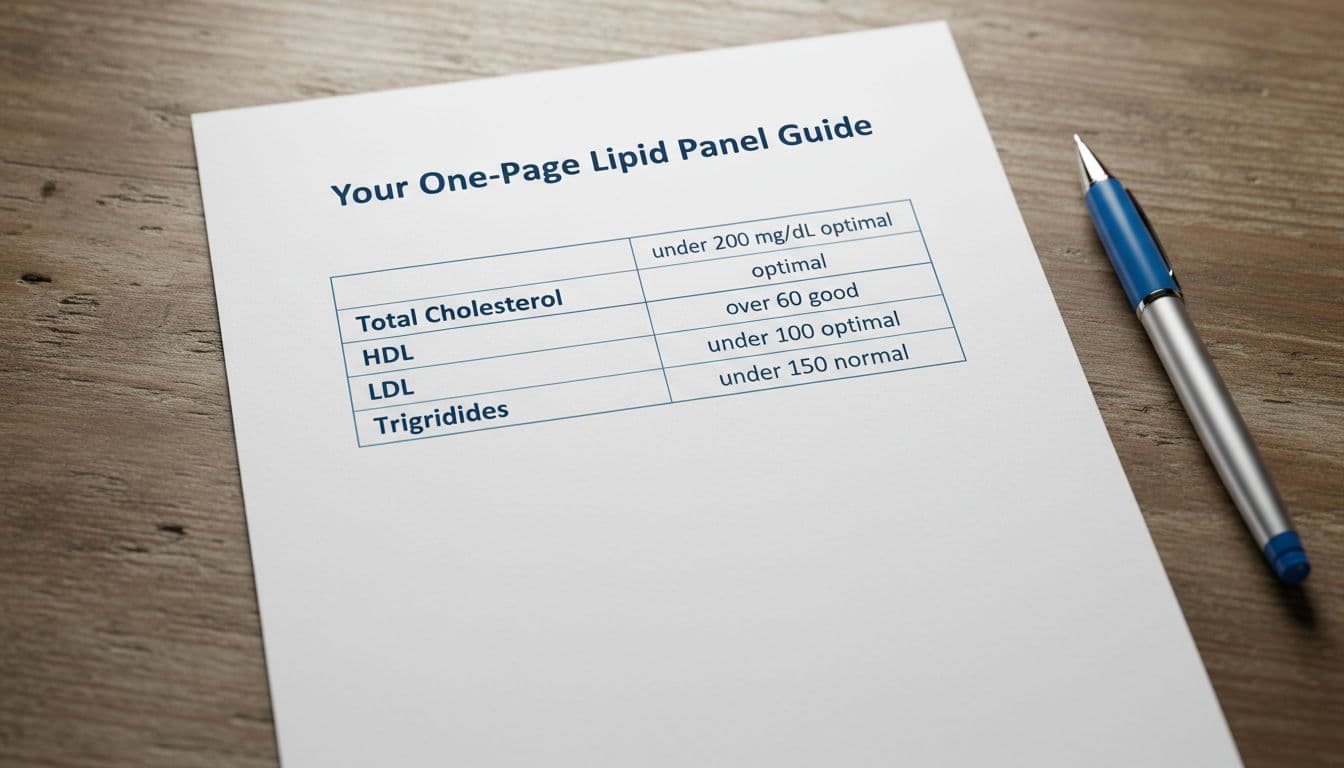
These commonly used adult “desirable” cut points help you get oriented (mg/dL):
| Test on your report | Desirable starting point | If it’s higher (or lower) | What it often suggests |
|---|---|---|---|
| Total cholesterol | < 200 | Higher isn’t always “bad,” but needs context | Can rise with LDL, with high HDL, or both |
| LDL-C | < 100 | Higher means more cholesterol carried in LDL | Higher long-term artery risk for many people |
| HDL-C | ≥ 60 is “protective” | Low HDL can add risk | Often improves with movement and metabolic health |
| Triglycerides | < 150 | Higher can drive a worse pattern | Often linked to sugar, refined carbs, alcohol, insulin resistance |
| Non-HDL cholesterol (if listed) | Lower is better | Often a stronger “all bad particles” signal | Helpful when triglycerides are high |
Those ranges match many patient-facing references, including Merck’s quick table: desirable lipid levels in adults, and the American Heart Association’s overview: what cholesterol levels mean.
One more helpful rule: trends beat single tests. Hydration, recent illness, big diet shifts, and lab timing can nudge results.
If your results surprised you, ask, “Is this a one-time spike, or a pattern?” Patterns guide smart changes.
How to read lipid panel results like a story (not four separate grades)
A lipid panel makes more sense when you connect numbers that tend to move together.
Pattern 1: High triglycerides plus low HDL
This combo often shows up when the body struggles with carb handling. Sugary drinks, sweets, refined grains, and extra alcohol can push triglycerides up. Meanwhile, consistent training often nudges HDL higher.
In real life, this is where a steady healthy living diet and exercise routine pays off. Not perfection, just repetition. Many people do best with a healthy food diet that leans on fiber-rich carbs (beans, oats, fruit) and cuts “liquid sugar.”
Pattern 2: High LDL with normal triglycerides
This can point toward saturated fat intake, genetics, thyroid issues, or just a higher baseline. It’s also where extra markers can matter. If you want a deeper look beyond LDL, particle-focused tests can help clarify risk. A simple next read is ApoB vs LDL for heart risk, especially if your report and your lifestyle don’t seem to match.
Pattern 3: Total cholesterol is high, but HDL is high too
Total cholesterol can look scary even when part of it is “good.” That’s why LDL, non-HDL, and your risk factors matter. MedlinePlus has a straightforward overview if you want a government health reference: cholesterol levels basics.
Pattern 4: “Everything looks fine,” but family history is loud
If early heart disease runs in your family, standard results may not tell the whole story. Some people carry inherited risk through particles like lipoprotein(a). If that sounds like you, consider learning about the Lipoprotein(a) test for heart risk.
Improve your next lipid panel with food and movement you can repeat
A better lipid panel rarely comes from one heroic salad. It comes from a rhythm you can keep when you’re tired, busy, or traveling.
Start with food because it’s daily. A heart healthy diet usually means: more soluble fiber, more unsaturated fats, fewer ultra-processed foods, and less saturated fat. In other words, build meals around real healthy food that still tastes good.

Two high-impact moves:
First, stack soluble fiber. Oats, beans, lentils, apples, and chia act like a gentle net in the gut. If you want a simple starter template, use soluble fiber lowers LDL cholesterol and repeat it until it’s automatic.
Next, swap fats instead of cutting all fats. Use olive oil, nuts, seeds, and avocado more often. This kind of healthy nutrition supports lipids and keeps meals satisfying, which helps you stick with it.
Movement matters too, especially for triglycerides, HDL, blood pressure, and insulin sensitivity. Aim for cardio you can recover from plus basic strength work. That’s the heart of sports and exercise for long life. If you want an evidence-based exercise overview, see Medical News Today’s summary: exercises to lower cholesterol.
The goal isn’t “perfect numbers next month.” It’s less lifetime exposure to risky particles, through nutrition to prevent illness and steady movement.
If your report includes non-HDL (or your triglycerides run high), this practical guide can help you build meals without guesswork: Lower non-HDL cholesterol food plan. For a broader kitchen-based approach, keep this bookmarked: Heart-healthy foods grocery guide.
If you’re creating a printable version of your own one-page guide, you can also pull free, royalty-free lifestyle images from Unsplash organic label photos.
Conclusion
Your lipid panel results aren’t a verdict, they’re a map. Read the pattern first (LDL, non-HDL, triglycerides, HDL), then connect it to habits you can repeat. A steady heart healthy diet, paired with sports and exercise for long life, often changes the story more than people expect. Bring your one-page guide to your next appointment, then ask one simple question: “What’s the most important number for my risk, and what’s the next doable step?”


0 Comments